

Most camps "measure" program quality with two things: a vague end-of-session parent survey and the director's gut feeling walking the grounds. Both feel like data. Neither tells you whether your archery program actually taught anything, whether your leadership track changed how teens behave, or why your STEM week keeps underperforming on re-enrollment even though parents say they loved it.
The gap isn't effort. Evaluation gets treated as a reporting chore at the end of the season instead of a system that runs alongside your programs and feeds real decisions. When it's designed well, it tells you which programs to expand, which to cut, which counselors to pair with which activities, and — this is the part most camps miss — it ties program quality directly to enrollment and retention. That connection is the whole point. A program can have glowing smiley-face surveys and still quietly bleed campers the following year.
This is a system article. We're going to cover how outcomes, instruments, cadence, dashboards, and decision rules fit together, where the whole thing tends to break as a camp grows, and what a usable version actually looks like.
Why camp evaluation breaks (and it's usually structural)
The common failure isn't "we don't measure." It's that camps measure the wrong layer. Satisfaction surveys ask "Did your child have fun?" and get 92% yes. Great — but fun is downstream of a dozen things, and it doesn't distinguish a program that taught a skill from one that just filled time pleasantly.
-
Small camps (under ~300 campers/season) rely almost entirely on the director's direct observation. It works because one person sees everything. The problem is it doesn't survive growth, and it's impossible to defend to a board or a funder because none of it is written down.
-
Mid-size camps (~300–800) add a survey tool but never define what "good" looks like per program. Every program gets the same generic questions, so a woodworking shop and a swim progression get evaluated identically. The data is technically collected and operationally useless.
-
Larger multi-program camps (800+) drown in data. Multiple surveys, attendance logs, incident reports, re-enrollment numbers — all living in separate places. Nobody connects "the climbing program scored low on skill progression" with "climbing had the worst week-to-week retention." The signals exist; they're just never in the same room.
The root issue across all three: outcomes are never defined by program type. You can't measure learning if you haven't decided what each program is supposed to produce.
Start with an outcome taxonomy by program type
Before any survey, you need a short taxonomy that says what kind of outcome each program is responsible for. Not every program teaches the same thing, and pretending they do is why generic evaluation fails.
Simplify camp operations with centralized control.
Campyly empowers you to manage registrations, staff, and activities seamlessly—all from one platform.
- Integrated camper and staff management
- Automated notifications and alerts
- Dynamic scheduling and resource allocation
No credit card required
| Program type | Primary outcome category | What you're actually measuring | Example signal |
|---|---|---|---|
| Skill-based (swim, archery, riding, climbing) | Skill progression | Measurable movement up a defined ladder | % of campers advancing at least one level |
| Arts & maker (ceramics, theater, woodworking) | Creative confidence + completion | Finished work + willingness to take creative risk | Completion rate of projects; self-rated confidence shift |
| Social/leadership (CIT, teen track, cabin life) | Behavioral & social growth | Observable change in cooperation, initiative | Counselor behavioral ratings over time |
| Adventure/outdoor (hiking, canoeing trips) | Resilience + competence | Independence in real conditions | Successful trip participation; self-efficacy shift |
| STEM/enrichment | Knowledge + engagement | Grasp of concepts + desire to continue | Pre/post concept check; "want to do again" rate |
The point of the taxonomy isn't academic precision. It's that once a program has an outcome category, the right measurement instrument becomes obvious. A skill program needs a progression ladder. A leadership program needs behavioral observation. Forcing both into the same parent satisfaction survey is the mistake.
One thing worth sitting with: programs with the fuzziest outcomes — leadership, social growth — are almost always the ones camps charge premium prices for and are the worst at evaluating. That's exactly backwards. The more you charge on the promise of "growth," the more you need evidence it actually happened.
Match the instrument to the outcome, not the convenience
Skill progression ladders. For anything with a natural skill hierarchy, define 3–5 levels and have instructors mark where each camper starts and ends. This is the single highest-value instrument most camps don't use. A swim program using a five-level ladder can report "68% of beginners advanced at least one level this week" — a number that means something to a parent and to you.
Pre/post self-ratings. For confidence, knowledge, and social growth, a short 3–5 question self-rating on day one and the last day captures shift. The trick is keeping it to the same questions both times. "How confident are you speaking in front of the group?" on a 1–5 scale, asked twice, gives you a delta per camper.
Counselor behavioral observation. For social and leadership outcomes, counselors rate campers on a small rubric mid-session and end-of-session. Keep it to 3–4 observable behaviors. Vague traits ("maturity") produce garbage; observable behaviors ("asked to help without being told," "included a struggling peer") produce usable signal.
Keep counselor rubrics to 3–4 observable behaviors to preserve inter-rater reliability and make mid-session fixes actionable.
Project/completion tracking. For arts and maker programs, completion is a clean proxy. Did the camper finish a piece they're proud of? A simple finished/not-finished plus a one-question confidence rating does the job.
Parent surveys — but narrow. Parents can't rate skill progression; they weren't there. They can rate what they observed at home afterward ("Is your child talking about continuing swimming?") and their likelihood to re-enroll. Keep parent surveys focused on perception and intent, not outcomes they didn't witness.
The pattern to avoid: collecting five instruments and analyzing none because the data lands in five different spreadsheets. Fewer instruments, actually reviewed, beats comprehensive data nobody opens.
Survey template: camper pre/post (skill + confidence)
-
On a scale of 1–5, how good are you at [skill] right now?
-
On a scale of 1–5, how confident do you feel trying something hard in [program]?
-
Do you want to keep doing [program] after camp? (Yes / Maybe / No)
-
One word for how [program] made you feel this week
Survey template: counselor behavioral rubric (mid + end)
-
Took initiative without being prompted
-
Included or helped a peer
-
Stuck with a difficult task instead of quitting
-
Followed group expectations
Survey template: parent re-enrollment intent (post-session)
-
Which program did your child talk about most at home?
-
Have you noticed any change in [skill/confidence/behavior] since camp? (Open text)
-
How likely are you to re-enroll your child next season? (1–10)
-
If below 7, what would change that?
That last question is worth reading every single week. It's your retention leak detector.
Cadence: when you analyze matters as much as what you collect
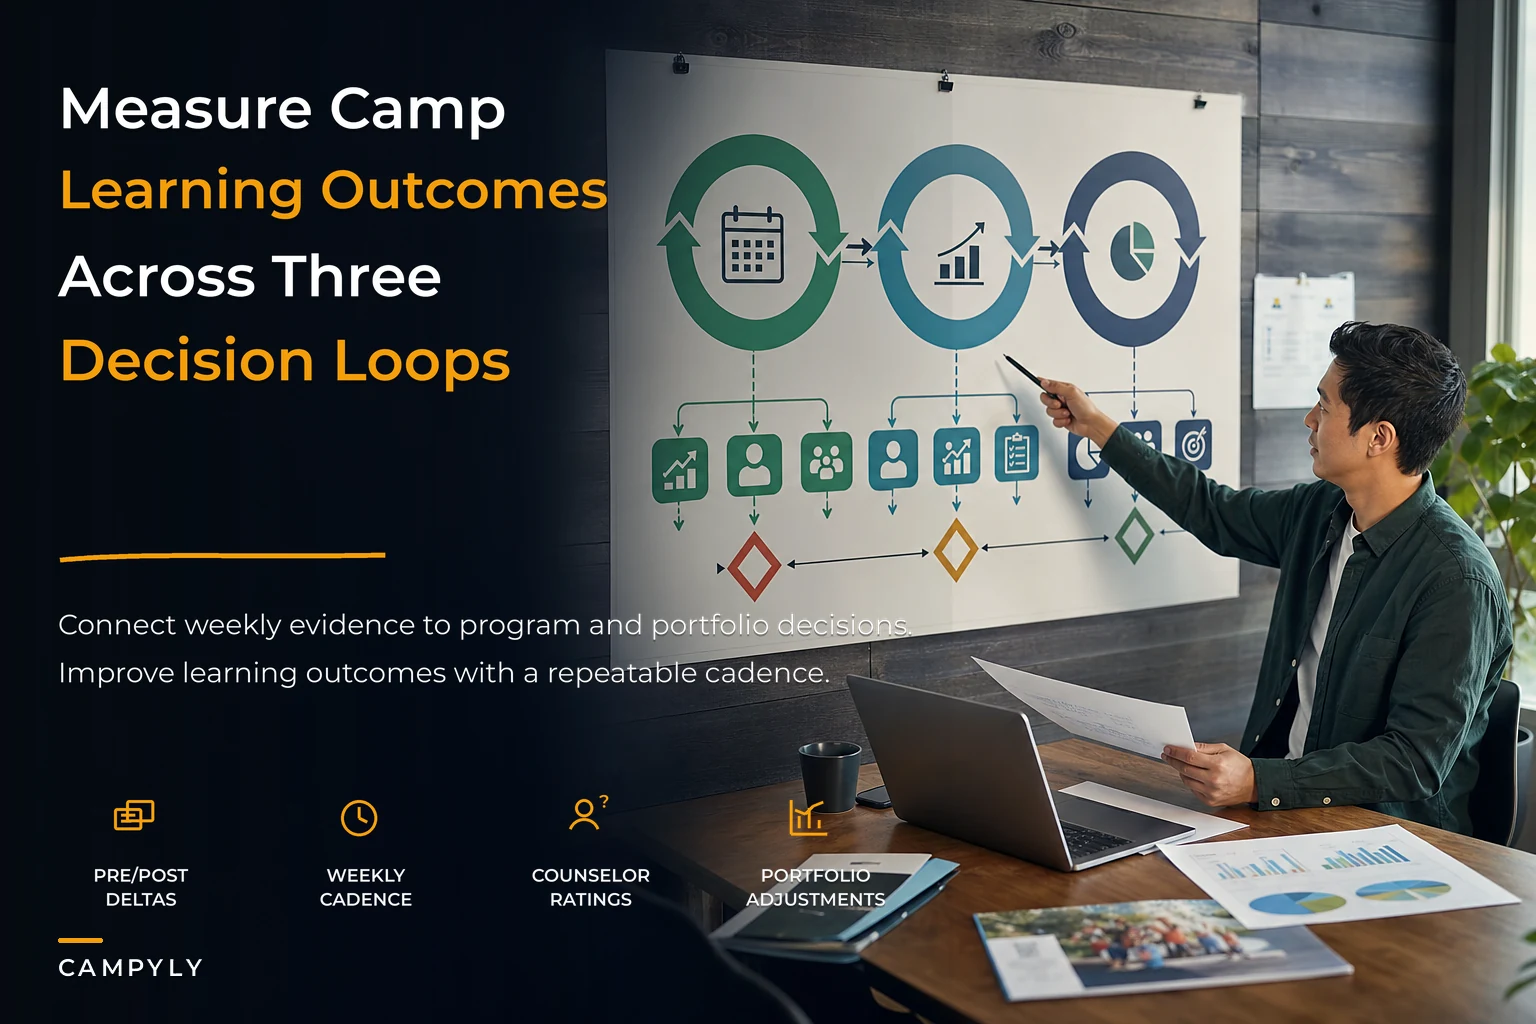
Collecting data once at season's end is the most common cadence and the least useful. By the time you see it, you can't fix anything and you can barely remember the session clearly. A real cadence runs on three loops:
-
Weekly (operational loop). Pull the week's pre/post deltas and counselor ratings for each program. Flag any program where fewer than roughly half of campers showed skill progression, or where parent intent scores dropped. This is the loop that lets you fix a program mid-season — swap an instructor, adjust group sizes, change the activity sequence.
-
End-of-session (program loop). After each session, roll up outcomes by program type and compare against your taxonomy's targets. This is where you spot the program that's consistently underperforming across sessions, not just having one bad week.
-
End-of-season (strategic loop). Connect program outcomes to actual re-enrollment and enrollment demand. This is the loop that informs your program portfolio and pricing decisions — which ties directly into your seasonal program portfolio and pricing playbook.
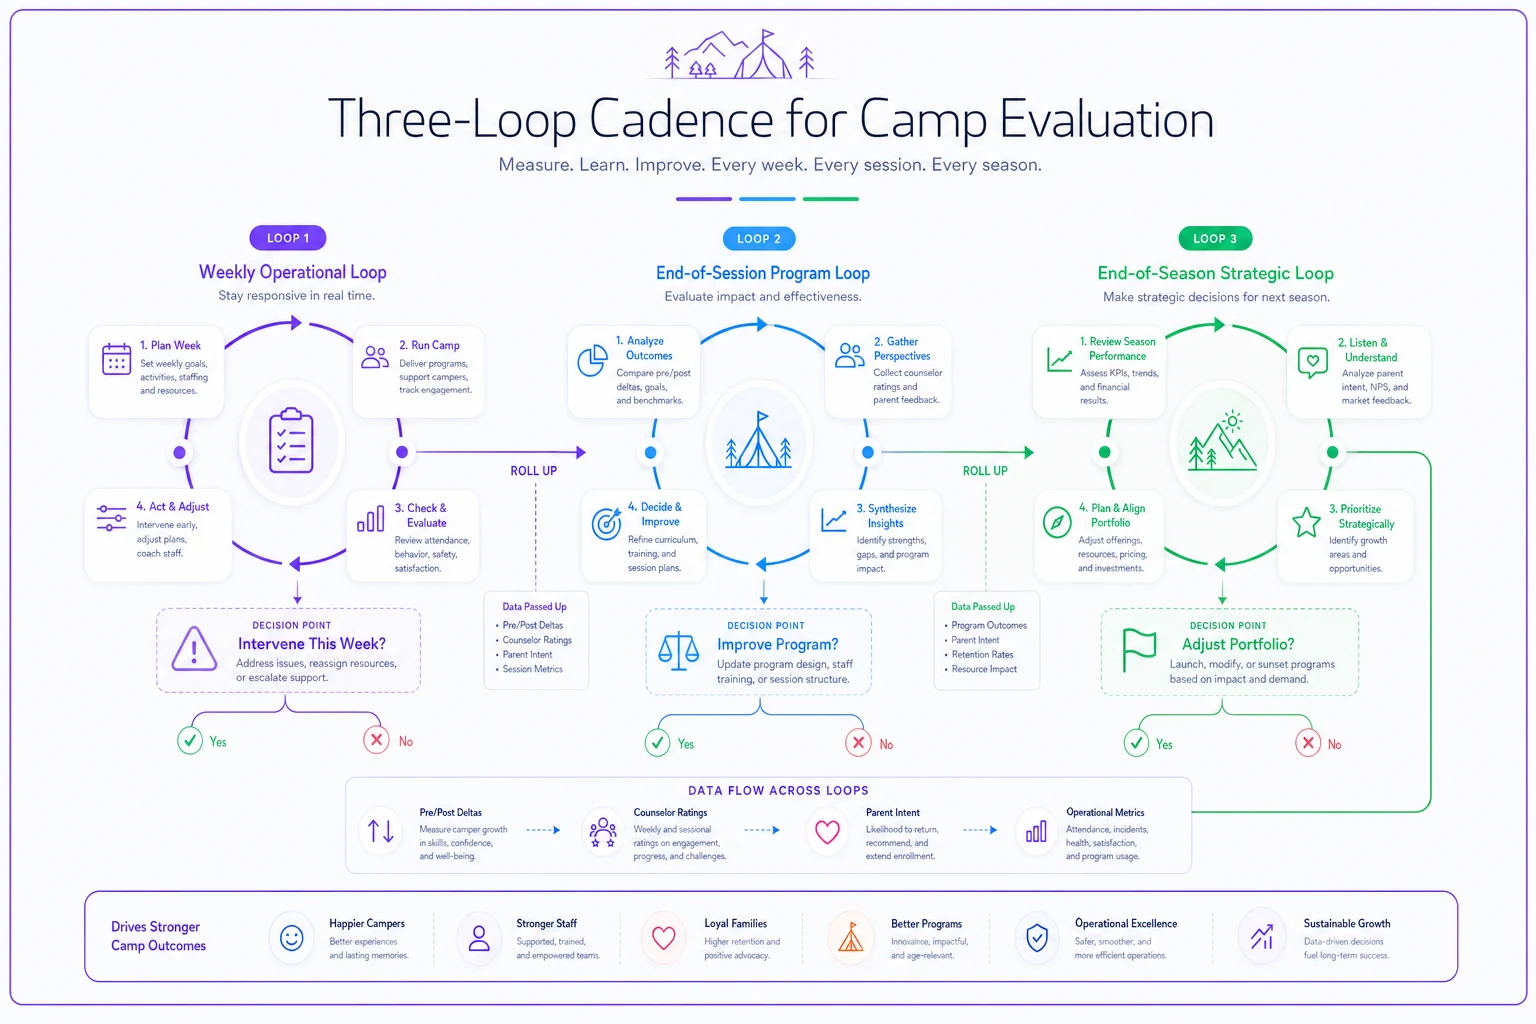
The mistake here is running only the strategic loop. Camps that skip the weekly loop lose the ability to save a struggling program before the families in it decide not to return. Evaluation that can't change anything this season isn't evaluation — it's a post-mortem.
Leader dashboards: what actually goes on the screen
A dashboard that tries to show everything shows nothing. The director's view should fit on one screen and answer three questions: Which programs are teaching? Which programs are losing families? Where do I need to intervene this week?
Fields that earn their place:
-
Program name + outcome category (from your taxonomy)
-
Skill progression rate — % of campers advancing at least one level (skill programs only)
-
Confidence delta — average pre/post self-rating change
-
Behavioral growth score — average counselor rubric change (social/leadership programs)
-
Completion rate (arts/maker programs)
-
Parent re-enrollment intent — average 1–10 score for families in that program
-
Low-intent flag count — number of parents who scored below 7
-
Enrollment trend — this program's fill rate vs. last comparable session
-
Prior-year retention — % of this program's campers who returned
The field that quietly matters most is the pairing of low parent intent with weak outcomes. When a program shows both, you have your answer: it's not pulling its weight and it's actively costing you returning families. When outcomes are strong but intent is low, you have a different problem — the learning is happening but the value isn't being communicated to parents. That's a marketing fix, not a program fix.
If you already track operational metrics, this evaluation dashboard should sit next to — not replace — your broader KPI framework for operational health. Program learning outcomes are one layer; operational health is another. Looking at them together is where decisions get sharp.
Decision rules: tying program quality to enrollment and retention
Data without decision rules becomes a collection of charts people admire and ignore. Write the rules down before the season so you're not negotiating with yourself when a favorite program underperforms.
A workable rule set:
-
Expand a program when skill/behavioral outcomes are strong AND parent re-enrollment intent averages 8+ AND it's filling. These are your growth candidates — add sessions or raise price.
-
Fix a program when outcomes are strong but intent is below 7. The learning works; the story doesn't reach parents. Tighten how you communicate results home.
-
Re-staff or redesign when intent is high but outcomes are weak. Families like the vibe but campers aren't progressing — usually an instructor or activity-sequence issue.
-
Cut or rebuild when outcomes are weak AND intent is low across multiple sessions. This program is consuming staff, space, and goodwill. Don't let sentiment override two seasons of evidence.
The hard one is the "re-staff or redesign" quadrant, because it's invisible to camps using only satisfaction surveys. Happy families mask a program that teaches nothing — until a year later when those campers don't re-enroll and you can't figure out why. Weak outcomes are a leading indicator of retention loss; satisfaction is a lagging one that often lies.
Because retention decisions live right here, this framework works best when it feeds your broader family engagement work — the stuff covered in turning first-time families into loyal campers. Program outcomes are one of the strongest levers on whether a first-year family becomes a multi-year family.
A real scenario: the leadership track that scored great and still lost kids
A mid-size overnight camp ran a two-week teen leadership track — roughly 40 campers a session, priced a few hundred dollars above their standard program. Parent satisfaction surveys came back around 90% positive every year. On paper, a hit.
But their teen re-enrollment sat around 55%, noticeably below the camp's overall rate. Nobody connected the two until they added a simple behavioral rubric and a pre/post self-efficacy rating. The data was uncomfortable: campers weren't showing measurable growth in initiative or leadership behaviors. They were having a lovely social time, but the "leadership" promise wasn't landing.
The fix wasn't dramatic. They redesigned the track around concrete leadership responsibilities — each teen ran a real activity for younger campers, with counselor coaching and a before/after rubric. The next season, behavioral growth scores moved meaningfully, and parent open-text responses shifted from "she had so much fun" to "she came back more responsible." Teen re-enrollment climbed into the high 60s to low 70s over the following two seasons. Same price, same staff headcount. The difference was knowing the program wasn't producing its promised outcome — something satisfaction data had hidden for years.
Where software fits (and where it doesn't)
Most of this framework is design work — taxonomy, instruments, decision rules — and no tool does that thinking for you. Where tooling earns its keep is the part that actually kills evaluation programs: the manual labor of collecting, consolidating, and surfacing data every week across multiple programs and hundreds of campers.
That's the realistic breaking point. A director can hand-tabulate surveys for 200 campers once. They cannot do it weekly for 700 across a dozen programs — so the weekly loop quietly dies and evaluation collapses back into an end-of-season formality. This is where an AI-assisted operational platform helps: pulling attendance, pre/post responses, and counselor ratings into one place, flagging programs that cross your decision thresholds, and surfacing the weekly summary so the data actually gets reviewed instead of compiled and forgotten. The goal isn't to replace the director's judgment — it's to make sure the right three programs land in front of that judgment each week instead of being buried in spreadsheets.
When this framework makes sense — and when it doesn't
It makes sense when you run multiple distinct programs, charge differentiated prices, or make real decisions about what to expand and cut. The more program variety and the more you lean on "growth" and "skill-building" in your marketing, the more you need evidence behind those claims.
It's overkill when you're a single-program day camp with 50 kids and the director personally sees every activity. A behavioral rubric across four programs is wasted effort when there's one program and total visibility. Start with a two-question pre/post and the re-enrollment intent question — that's enough signal at that size.
Who should hold off: camps mid-crisis on basics. If attendance reconciliation, staffing, or safety systems aren't solid yet, fix those first. Learning-outcome evaluation is a refinement layer; it assumes the operational foundation underneath it is already stable.
Bringing it together
The camps that get real value from camp program evaluation aren't the ones with the longest surveys. They're the ones who decided — ahead of time — what each program is supposed to produce, picked instruments that actually measure it, reviewed the data on a cadence that still allows them to act, and wrote decision rules that connect program quality to whether families come back.
That connection is everything. A program isn't good because parents smiled on a survey. It's good because campers measurably grew and those families re-enrolled. Build the system so those two facts sit side by side on one screen, and the decisions about what to grow, fix, and cut mostly make themselves.
That connection is everything. A program isn't good because parents smiled on a survey. It's good because campers measurably grew and those families re-enrolled. Build the system so those two facts sit side by side on one screen, and the decisions about what to grow, fix, and cut mostly make themselves.
Ready to elevate your camp management?
Join 500+ camps using Campyly to save administrative time, enhance camper experiences, and streamline daily operations.