


Your camp just wrapped another season. Parents are happy, kids went home with memories, and staff survived eight weeks of organized chaos. But around October, every camp director faces an uncomfortable question: did we actually run a healthy operation, or did we just get lucky?
Most camps track the obvious stuff. Revenue, enrollment numbers, maybe some basic satisfaction scores. But there's a clear pattern that separates camps that consistently improve from those stuck in the same operational loops year after year. The difference? They track camp KPIs that actually predict future success, not just document past performance.
The real challenge isn't collecting data—camps generate mountains of information daily. It's knowing which numbers matter for operational decisions versus which ones just make you feel busy. Too many camps drown in spreadsheets while missing the warning signs that next season's problems are already forming.
Why Traditional Camp Metrics Miss the Mark
Walk into most camp offices in November and you'll find directors surrounded by registration reports, budget spreadsheets, and maybe some parent feedback forms. These tell you what happened, but they don't tell you what's breaking in your operation.
I worked with a Vermont camp that had stellar enrollment numbers for three straight years. Parents loved them, returning camper rate sat around 78%, and they hit budget targets consistently. By every traditional measure, they were crushing it. Then year four hit—half their senior staff didn't return, they scrambled to fill counselor positions, training suffered, and parent complaints spiked. The warning signs were there in their data two years earlier, but they weren't tracking the right things.
Focusing only on enrollment and revenue is like driving by watching the rearview mirror. These are outcomes, not indicators. By the time these numbers show problems, the operational damage is already done. Your registration might look healthy while your staff pipeline collapses. Your budget might balance while your capacity planning creates bottlenecks that frustrate parents and exhaust staff.
Camp operations involve hundreds of moving pieces that affect each other. A small drop in staff return rate this year becomes a training crisis next year, which becomes a safety incident the year after, which becomes a reputation problem that tanks enrollment.
The Five Camp KPIs That Actually Matter
After working with camps ranging from 50-kid day programs to 500-camper overnight operations, five metrics consistently predict whether a camp will thrive or struggle. These aren't the sexiest numbers, but they're the ones that reveal operational health before problems become visible.
Simplify camp operations with centralized control.
Campyly empowers you to manage registrations, staff, and activities seamlessly—all from one platform.
- Integrated camper and staff management
- Automated notifications and alerts
- Dynamic scheduling and resource allocation
No credit card required
Registration Conversion Rate tells you how well your camp turns interest into commitment. Not just final enrollment numbers, but the percentage of inquiries that become deposits, deposits that become full payments, and registrations that actually show up on day one. A camp with 1,000 inquiries and 200 enrollments has different operational challenges than one with 400 inquiries and 200 enrollments, even though they end up at the same place.
Capacity Utilization shows whether you're using your resources efficiently. This goes beyond simple enrollment percentages. It includes bunk utilization for overnight camps, activity station usage throughout the day, dining hall flow, and transportation efficiency. Poor capacity planning creates invisible stress throughout your operation—counselors managing oversized groups, activities with equipment shortages, buses running multiple trips when one properly planned route would work.
Staff Fill Rate measures not just whether you have bodies in positions, but whether you have the right people in the right roles at the right time. A camp might be "fully staffed" on paper while running with undertrained counselors, missing specialty instructors, or constantly shuffling people to cover gaps. This metric needs to track planned positions versus filled positions, plus qualification matches and training completion rates.
Incident Rate covers everything from scraped knees to behavioral issues to equipment failures. Not because every Band-Aid represents failure, but because patterns in incidents reveal operational weak points. A spike in minor injuries at the climbing wall might indicate equipment wear, training gaps, or scheduling pressure that pushes safety margins.
Net Promoter Score (NPS) specifically from parents, not campers. Kids might love a chaotic, loosely-run program. Parents recommend camps that demonstrate operational excellence. Their NPS reflects whether your operation inspires confidence, and that confidence drives next year's registration.
These five metrics work together. High registration conversion with low capacity utilization suggests pricing problems. Strong NPS with poor staff fill rates indicates you're burning out good people to maintain quality.
Building Your Measurement Infrastructure
The biggest mistake camps make with data isn't measuring too little—it's trying to measure everything without a system. You need clear data sources, consistent collection methods, and realistic reporting schedules that match your operational rhythm.
Start with registration conversion. Your data lives in three places: website analytics, registration software, and payment processing. Website forms tell you initial interest. Registration software tracks the journey from inquiry to enrollment. Payment processing shows actual completion. Most camps look at these separately, missing the story they tell together.
One New Jersey day camp discovered that 40% of parents who started online registration abandoned it midway through. The form was too long, asked for information parents didn't have handy, and timed out after 20 minutes of inactivity. They simplified the initial registration, captured basic info first, and saw conversion jump by 15 percentage points—around 30 additional campers without spending more on marketing.
Capacity utilization requires mapping your actual resources against usage patterns. Track not just enrollment against total capacity, but usage throughout the day. When are your activity areas overcrowded? When do bottlenecks form in transitions? Where do counselors struggle with group sizes?
An overnight camp in Colorado thought they had a capacity problem—parents complained about waitlists while the camp felt constantly overstretched. The data showed their theoretical capacity was 220 campers, but their dining hall could only efficiently serve 180 in their meal windows. Meanwhile, their waterfront could handle 60 swimmers at once but rarely had more than 35. They were simultaneously over and under capacity.
Staff data often lives in multiple disconnected places. Applications in one system, training records in another, schedules in a third, performance notes in counselors' heads. You need a single source of truth for staff information that tracks the full lifecycle from application through end-of-season evaluation.
Creating Reporting Rhythms That Drive Decisions
Raw data without regular review is just digital clutter. You need reporting cadences that match when you can actually act on the information.
During active camp season, focus on operational metrics that you can adjust in real-time. Daily incident reports, capacity utilization by activity area, and staff coverage gaps need immediate attention. A climbing wall with three incidents in two days needs investigation now, not in September's quarterly review.
Registration periods require weekly tracking of conversion metrics. How many inquiries this week? What's the conversion rate from inquiry to deposit? Are certain sessions filling faster than others? This weekly rhythm lets you adjust marketing messages, modify payment terms, or add capacity before you lose momentum.
Off-season monthly reviews should examine trends and patterns. Look at year-over-year changes in your key metrics. Compare this year's staff retention to previous seasons. Analyze which marketing channels drive the highest-converting inquiries.
Quarterly deep dives connect operational metrics to strategic goals. If you want to grow enrollment by 20%, what does that mean for staff fill rates? If you're adding a new program area, how will it affect capacity utilization?
Every reporting session should end with decisions: what do we change, what do we test, what do we investigate further? Data without decisions is just expensive record-keeping.
Sample Dashboards That Actually Get Used
Most camp dashboards fail because they try to show everything at once. Directors end up with 47 charts that take an hour to interpret, so they stop looking. Effective dashboards focus on the decisions you need to make in that moment.
Your seasonal operations dashboard during active camp weeks should fit on one screen:
| Dashboard | Description |
|---|---|
| Daily Safety Snapshot | Incident count, types, locations, and trends. Show this week versus last week and versus same week previous year. |
| Capacity Heat Map | Visual representation of where you're over or under utilized. Red zones need immediate attention, yellow zones need monitoring, green zones are balanced. |
| Staff Coverage Grid | Who's where, who's missing, who's covering. Include certification expirations and required ratios. |
| Parent Communication Pulse | Response times to parent inquiries, unresolved issues, and NPS trend line. |
| Registration Pipeline | Upcoming session enrollment status, waitlist movement, and payment collection status. |
Your registration period dashboard looks completely different:
| Dashboard | Description |
|---|---|
| Conversion Funnel | Inquiries → Applications → Deposits → Confirmed → Attended, with percentages at each stage. |
| Session Fill Rates | Visual blocks showing each session's capacity, with color coding for pace (ahead, on track, behind previous year). |
| Channel Performance | Which marketing sources drive inquiries and which drive actual enrollments. Cost per camper by channel. |
| Geographic Distribution | Map showing where campers come from, identifying expansion opportunities or concerning gaps. |
| Payment Status | Outstanding balances, payment plan adherence, and financial aid utilization. |
Your strategic planning dashboard for quarterly reviews:
| Dashboard | Description |
|---|---|
| Five-Year Trend Lines | Your five key KPIs over time, showing trajectory and volatility. |
| Cohort Analysis | Following specific camper groups through multiple years, identifying retention patterns. |
| Staff Lifecycle Metrics | Application to hire ratios, training completion rates, season completion rates, return rates, all compared across years. |
| Program Area Performance | Enrollment, utilization, incidents, and satisfaction by program area. |
| Financial Health Indicators | Revenue per camper, cost per camper, margin trends, and cash flow patterns. |
Most camp dashboards fail because they try to show everything at once. Directors end up with 47 charts that take an hour to interpret, so they stop looking. Effective dashboards focus on the decisions you need to make in that moment.
Decision Thresholds and Action Triggers
Data without decision rules is just noise. You need clear thresholds that trigger specific actions, removing the guesswork from operational responses.
For registration conversion, anything below 15% from inquiry to deposit signals a process problem. Below 10% means stop everything and fix it. Above 25% might mean you're underpriced or not reaching enough families.
A west coast camp noticed their conversion rate dropped from roughly 22% to around 14% between seasons. Instead of panicking about enrollment, they investigated the process. Their new registration system required parents to create accounts before viewing session details. They flipped the order—browse first, account later—and conversion bounced back to about 19%.
-
At 90 days before camp, you want 70% of positions filled.
-
At 60 days, 85%.
-
At 30 days, 95%.
Below these thresholds triggers specific actions: 60 days and under 85% means implement emergency recruiting. 30 days and under 95% means start building contingency plans for program modifications.
Incident rate thresholds require nuance. Minor injuries should stay below 4-6 per 100 camper-days. Moderate incidents requiring nurse visits below 1 per 100 camper-days. Any pattern—three similar incidents in a week, regardless of severity—triggers immediate investigation.
NPS thresholds for camp parents typically run: below 20 indicates serious problems, 20-40 suggests improvement needed, 40-60 represents solid performance, above 60 indicates exceptional operation. But movement matters more than absolute scores. A 10-point drop, even from 70 to 60, demands attention.
Integrating Data Systems Without Drowning
The average camp uses between 6 and 12 different software systems. Registration in one platform, payment processing in another, staff management in a third, communication in a fourth, health records in a fifth. Each generates data, but they rarely talk to each other.
Manual data integration—copying numbers from one system to another—kills consistency and accuracy. One counselor forgets to log an incident in the official system but mentions it in the communication app. Parent feedback comes through email, registration system surveys, and social media. Staff availability lives in text messages, scheduling software, and sticky notes on the director's desk.
This fragmentation makes it nearly impossible to see patterns until they become problems. You might have all the warning signs of a developing issue spread across five systems, but nobody connects the dots.
Operational platforms that bring these data streams together aren't just about convenience—they're about visibility. When your registration data, staff scheduling, incident tracking, and parent communication live in connected systems, patterns emerge automatically. AI-powered features can flag that climbing incidents increased when a new instructor started, suggesting a training review.
A simple workflow for integrating systems looks like this.
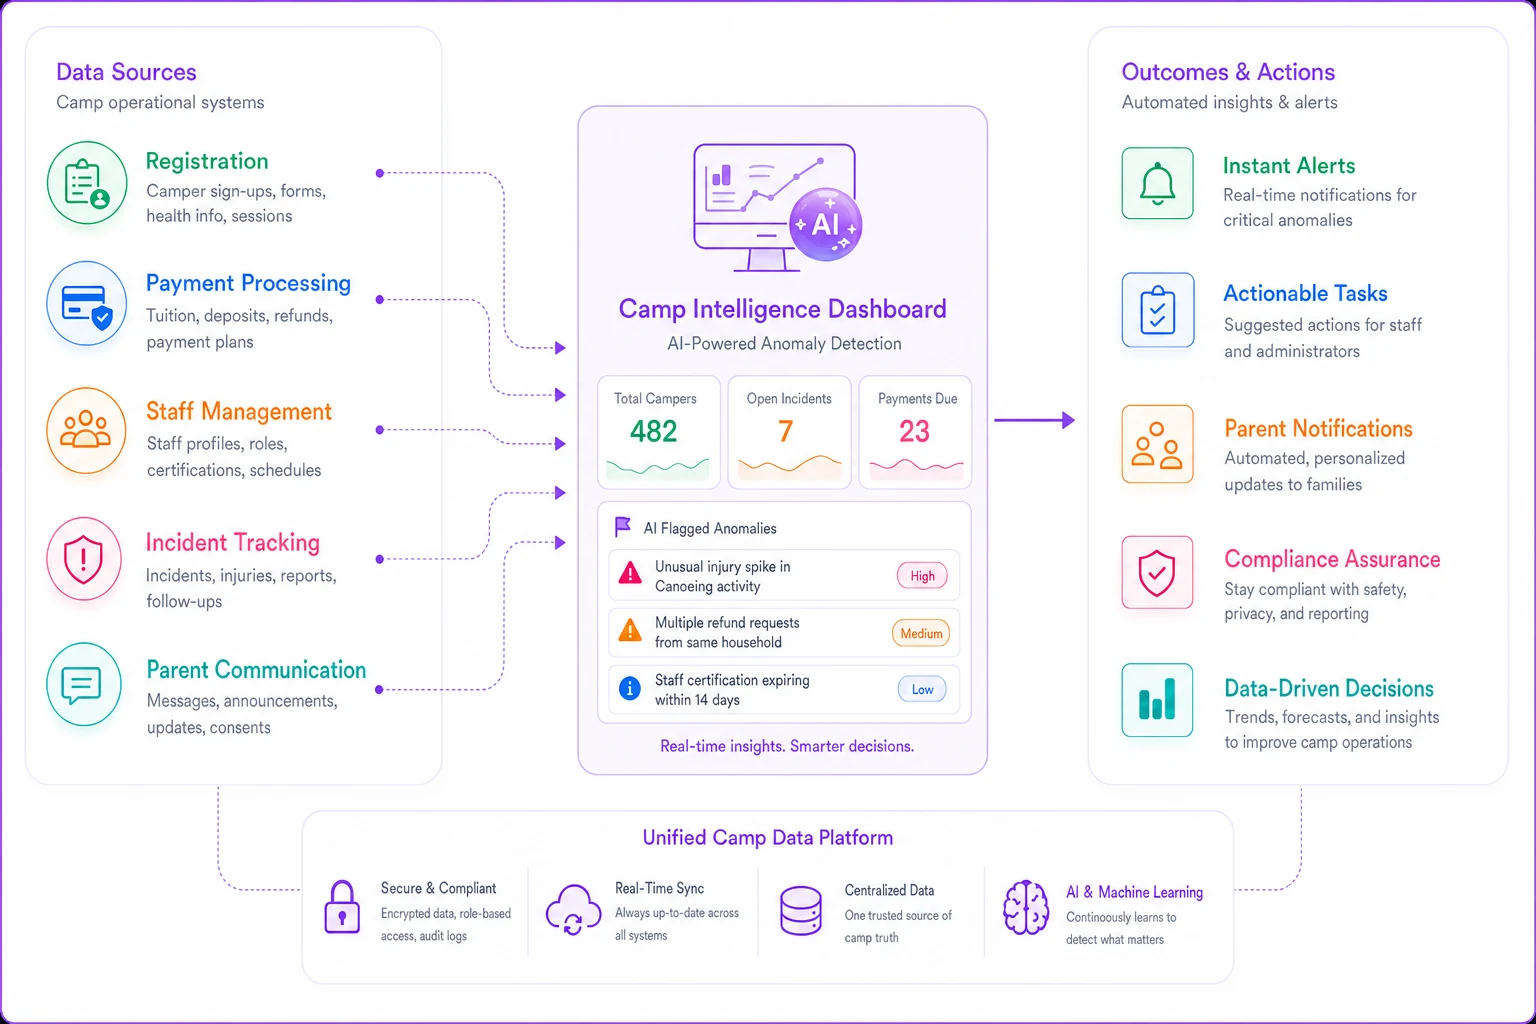
This integration also reduces the administrative burden on your team. Instead of spending hours every week compiling reports from different systems, your leadership can focus on acting on insights. Counselors log information once, in context, and it flows where it needs to go.
The return on this integration compounds over time. First-year baseline data becomes second-year comparison points, which become third-year predictive models. You stop reacting to problems and start preventing them.
When Good Camps Start Failing
The path from thriving camp to struggling operation rarely happens suddenly. It's a slow drift that becomes visible only when you track the right camp KPIs consistently.
I watched a Pacific Northwest camp with 40 years of history show exactly how this drift happens. Year one: Their senior counselor return rate drops from 65% to 55%. They wrote it off as coincidence—people graduate, move on, life happens. Year two: New counselor training scores slipped, but everyone's tired and camp still ran fine. Year three: Minor incidents increased around 20%, but kids are kids, right? Year four: Parent NPS dropped 12 points and registration slowed. Year five: They were in crisis mode, couldn't figure out what went wrong.
The cascade was predictable from year one's data. Lower staff retention meant less institutional knowledge. Less institutional knowledge meant weaker training. Weaker training meant more incidents. More incidents meant lower parent confidence. Lower parent confidence meant registration problems.
But imagine if they'd caught it year one. They notice the return rate drop, investigate why counselors aren't coming back, discover it's primarily compensation-related compared to other local opportunities. They adjust their pay structure, create better advancement paths, and the return rate stabilizes. The cascade never starts.
This is why systematic KPI tracking matters more than perfect data. Consistent measurement reveals trends before they become crises.
Making Data-Driven Decisions Without Losing Your Camp's Soul
The fear many camp directors express about "becoming too corporate" or "losing the magic" by focusing on metrics misses the point. Data doesn't replace the relationships, experiences, and values that make your camp special. It protects them.
When you know your operational health metrics, you can make confident decisions about what to preserve and what to change. Should you add that new program area parents are requesting? Check if your capacity utilization and staff fill rates can support it without sacrificing quality elsewhere.
A small arts-focused camp in Maine struggled with this balance. They prided themselves on their creative, flexible approach but kept running into operational problems—double-booked spaces, supplies running out, counselors overwhelmed by unexpected group sizes. They resisted "corporate metrics" until a particularly chaotic summer nearly broke them.
Starting small, they tracked just capacity utilization for their studio spaces. The data revealed that pottery was overcrowded every morning while drama space sat empty, then flipped in the afternoon. A simple schedule adjustment—offering two pottery sessions and balancing enrollment—immediately reduced stress. They kept their creative soul but ran more smoothly.
The camps that thrive long-term use data to protect what makes them unique, not standardize it away.
Building Your KPI System for Next Season
Starting fresh with camp KPIs doesn't require revolutionary change or massive technology investment. Begin with what you can measure consistently, expand as you build habits, and focus on decisions over perfection.
Pick two of the five core metrics to start. Registration conversion and staff fill rate usually offer the quickest insights with the least complex data collection. Set up simple tracking—even a well-organized spreadsheet beats nothing. Commit to reviewing them weekly during relevant periods.
Build your thresholds based on your own baselines, not industry averages. Your camp's "normal" depends on your market, mission, and model. Track for one full cycle before setting rigid triggers. Learn what your patterns look like before deciding what needs changing.
Connect your data to actual decisions. Every metric should answer a question that affects what you do next. If a metric doesn't change any decisions, stop tracking it. If you find yourself making the same decision repeatedly, look for the metric that could trigger it automatically.
Share the framework with your team. When counselors understand that incident tracking improves safety rather than assigns blame, they report more accurately. When program heads see how capacity utilization affects their areas, they help optimize schedules.
The Difference Between Surviving and Thriving
Camps that just survive each season repeat the same problems with slight variations. They scramble for staff every spring, deal with the same parent complaints every summer, and wonder every fall if they'll hit enrollment targets next year. It's exhausting, unsustainable, and completely preventable.
Camps that thrive use data to break these cycles. They see patterns early, adjust before problems compound, and build operational strength that supports their mission year after year. The difference isn't luck or magic—it's measurement that drives better decisions.
Camps that thrive use data to break these cycles. They see patterns early, adjust before problems compound, and build operational strength that supports their mission year after year. The difference isn't luck or magic—it's measurement that drives better decisions.
Ready to elevate your camp management?
Join 500+ camps using Campyly to save administrative time, enhance camper experiences, and streamline daily operations.