

Most camp directors build their staffing plans backwards. They count activities, divide by some ratio they heard at a conference, then hope counselors show up in June. By week three of summer, they're pulling kitchen staff to cover archery because two counselors quit and nobody accounted for the fact that teenagers get mono. A reproducible camp staffing model isn't about perfect ratios—it's about building capacity calculations that account for the messiness of running programs with seasonal labor. Camps that get their FTE calculations right tend to run smoother seasons. Those guessing at headcount are still scrambling through July.
Why Traditional Staffing Ratios Break Down
The standard approach most camps inherit looks something like: take your expected enrollment, divide by 8 for general counselors, add specialists for activities, throw in some admin roles. Works fine for a 60-camper day program. Scale to 200 residential campers across multiple sessions and those simple ratios create real problems.
The actual complexity is harder to model. Your waterfront needs certified lifeguards who can't float between activities. Your climbing wall instructor might cover low ropes but can't supervise ceramics. Kitchen staff work different hours than program staff. Some counselors are minors with hour restrictions. Activities have genuinely different supervision requirements—archery needs 1:4 ratios while hiking might run 1:12.
Then there's time-based capacity. A counselor working overnight can't cover morning activities. Your nurse on call from 7pm–7am needs different coverage calculations than your day program coordinator. Traditional headcount planning treats all positions equally, but a residential camp runs on three distinct capacity cycles that rarely line up.
The specialty certification problem deserves its own mention. You might have 15 counselors on paper, but only three with wilderness first responder training for overnight trips. Two have lifeguard certs. One speaks Spanish for bilingual families. Suddenly your "adequate" staffing looks completely different when you map actual capabilities against real program needs.
Building FTE-Equivalent Calculations by Activity Type
The foundation of a working camp staffing model starts with activity-based FTE calculations rather than simple headcount. Each activity carries its own capacity formula based on supervision requirements, setup time, and transition buffers.
Simplify camp operations with centralized control.
Campyly empowers you to manage registrations, staff, and activities seamlessly—all from one platform.
- Integrated camper and staff management
- Automated notifications and alerts
- Dynamic scheduling and resource allocation
No credit card required
Start with your core activity formula:
Base FTE per Activity = (Campers × Hours × Sessions per Week) ÷ (Ratio × Available Staff Hours)
That's just the starting point though. Layer in your reality adjustments:
-
Setup/breakdown time (usually 15–30 minutes per activity)
-
Transition supervision between activities
-
Documentation time for incident reports or parent communications
-
Certification maintenance (lifeguards need weekly in-service hours)
-
Weather contingency coverage when outdoor activities move inside
For a concrete example, waterfront staffing. Say you run swimming for 120 campers daily, with a 1:8 in-water ratio plus one deck supervisor per 25 campers:
Swimming FTE = ((120 ÷ 8) + (120 ÷ 25)) × 1.5 hours × 5 days ÷ 37.5 weekly hours
Swimming FTE = (15 + 4.8) × 7.5 ÷ 37.5 = 3.96 FTE
But you also need coverage for free swim, pool maintenance, and someone certified to run swim tests on arrival day. The actual need lands closer to 5.2 FTE for waterfront alone.
This method extends across all activities, with unique multipliers for each. Arts and crafts might need just 0.8 FTE per standard counselor due to lower ratios and minimal transition time. Adventure activities could require 1.4 FTE per position to account for equipment checks and safety briefings.
Contingency Headcount Buckets That Actually Work
What separates camps that survive staff shortages from those that cancel activities is structured contingency planning with pre-calculated coverage buckets. Most directors know they need backup staff. Few build the mathematical framework to figure out how many and where to deploy them.
Your contingency model needs three distinct buckets:
Bucket 1: Predictable Absences (15–20% above base) This covers known gaps—scheduled days off, pre-approved time away, predictable sick days based on historical patterns. For every 5 program staff, you need roughly 1 floater who can cover core activities.
Bucket 2: Specialist Backup (10% or minimum 2 per certification type) Every specialized role needs identifiable backup. If your climbing instructor gets injured, who has the certification to run the wall? Build a skills matrix showing primary and secondary qualified staff for each specialty area.
Bucket 3: Surge Capacity (5–8% additional) This is your emergency buffer—multiple sick counselors during a stomach bug outbreak, a sudden resignation, a family emergency pulling someone home mid-session. These staff members need broader training so they can slot into multiple roles without too much friction.
Build a skills matrix showing primary and secondary qualified staff for each specialty area.
| Activity Area | Base FTE | Predictable Coverage | Specialist Backup | Surge Buffer | Total Needed |
|---|---|---|---|---|---|
| Waterfront | 5.2 | 1.0 | 0.5 | 0.3 | 7.0 |
| Adventure | 3.8 | 0.8 | 0.5 | 0.2 | 5.3 |
| Arts | 2.4 | 0.5 | 0 | 0.2 | 3.1 |
| Sports | 4.1 | 0.8 | 0 | 0.3 | 5.2 |
| Nature | 1.9 | 0.4 | 0 | 0.1 | 2.4 |
The math shows you need 23 program staff, not the 18 you'd get from basic ratio calculations. A 28% buffer might feel excessive until you're in week four and genuinely grateful you planned for reality instead of the scenario you imagined in February.
Sample Seasonal Staffing Spreadsheets
The most useful camp staffing models use interconnected spreadsheets that adjust automatically when you modify enrollment projections or session schedules. Here's the framework that actually gets used, not just created and forgotten.
Sheet 1: Enrollment Projection by Session Map out expected campers by week, age group, and program type. Include columns for waitlist probability and historical show rates. A camp expecting 140 enrollments should model for 145–150 to account for last-minute additions, but staff for around 135 assuming some no-shows.
Sheet 2: Activity Demand Calculator Based on enrollment, calculate activity slots needed. If 140 campers each do 6 activities daily, that's 840 activity-slots to staff each day. Break this down by actual program offerings—not every camper does every activity every day.
Sheet 3: Staff Requirement Matrix Convert activity demand into FTE requirements using your refined formulas. Include certification requirements, setup time, and administrative hours. This sheet should feed directly from your enrollment projections so changes flow through automatically.
Sheet 4: Coverage Heat Map Visualize where coverage gets thin. Mark cells red when you're at minimum ratios, yellow for standard coverage, green for comfortable margins. This immediately shows danger zones in your schedule without requiring manual analysis.
Sheet 5: Budget Impact Tracker Every staffing decision has cost implications. Track hourly rates, overtime triggers, and housing costs for residential staff. Include costs that don't show up until later—background checks, training hours, meals during orientation.
Here's a practical formula for calculating weekly staffing costs with overtime:
Weekly Staff Cost = Σ(Base Hours × Rate) + ((Hours - 40) × Rate × 1.5) + (Housing + Meals + Benefits)
For seasonal planning, this becomes:
Seasonal Budget = Σ(Weekly Costs × Season Length) + (Recruitment Costs + Training Costs + End-of-Season Bonuses)
Scaling the Model Across Different Camp Sizes
A 50-camper day program and a 400-camper residential facility need fundamentally different approaches to capacity planning, but the underlying model scales if you adjust the parameters correctly.
For smaller camps (under 100 campers), contingency buckets might be individual people rather than percentages. You can't have 0.3 of a lifeguard. Instead, identify two or three multi-skilled staff who can pivot between roles. Your nature instructor might also carry a lifeguard cert. Your arts and crafts lead could cover quiet hours in the health center.
Medium camps (100–250 campers) hit the sweet spot where percentage-based planning actually works. You have enough staff that contingency buckets make mathematical sense, but operations are still simple enough that one person can track the moving pieces. This is where the spreadsheet model really earns its keep.
Large camps (250+ campers) need to think in terms of teams rather than individuals. You're not hiring a waterfront director—you're building a waterfront department with internal coverage redundancy. Contingency planning happens at the department level, with each area maintaining its own float pool. The complexity here requires either exceptional spreadsheet discipline or purpose-built camp operations software that can handle multi-area calculations without breaking down.
The scaling challenge isn't just about numbers. A small camp director can personally know every staff member's capabilities. At 300 campers, you need systematic skills tracking. That shift from "family operation" to something more structured is where a lot of camps struggle and often stall.
Managing Seasonal Capacity Variations
Summer camps face a compressed operational timeline that most industries don't deal with. Unlike year-round businesses that can gradually adjust staffing, camps need to scale from zero to full capacity in roughly two weeks, sustain peak operations for 8–12 weeks, then wind down fast.
The pre-season ramp-up calculation often gets overlooked entirely. You need approximately 40–60 hours of preparation per FTE before campers arrive. This includes:
-
Orientation and training (16–24 hours)
-
Facility preparation (8–12 hours)
-
Activity area setup (8–10 hours)
-
Safety drills and certification checks (6–8 hours)
-
Team building and program planning (8–10 hours)
Mid-season presents different challenges. Weeks 5 and 6 typically see peak burnout and the highest turnover. Smart camps front-load their contingency staff for these weeks rather than spreading coverage evenly across the summer.
Late season has its own pattern. Staff who make it past week 6 usually finish strong, but accumulated fatigue is real and college students start mentally checking out toward fall semester. Reduce activity complexity in final weeks and build in more rest time for staff before you need to.
Some camps successfully implement a rotation model where staff work 3-week or 6-week contracts instead of a full summer. This requires roughly 20% more total hires but can reduce mid-season turnover significantly. The math works like this:
Rotation Staff Needed = (Base FTE × 1.2) × (Season Length ÷ Rotation Length)
For a 9-week season with 3-week rotations and 20 base FTE: Rotation Staff = (20 × 1.2) × (9 ÷ 3) = 24 × 3 = 72 total hires
Compared to hoping 25 staff last all summer, the rotation model requires more recruiting but delivers more consistent energy on the ground.
The chart below helps visualize weekly staffing versus enrollment demand across a typical season.
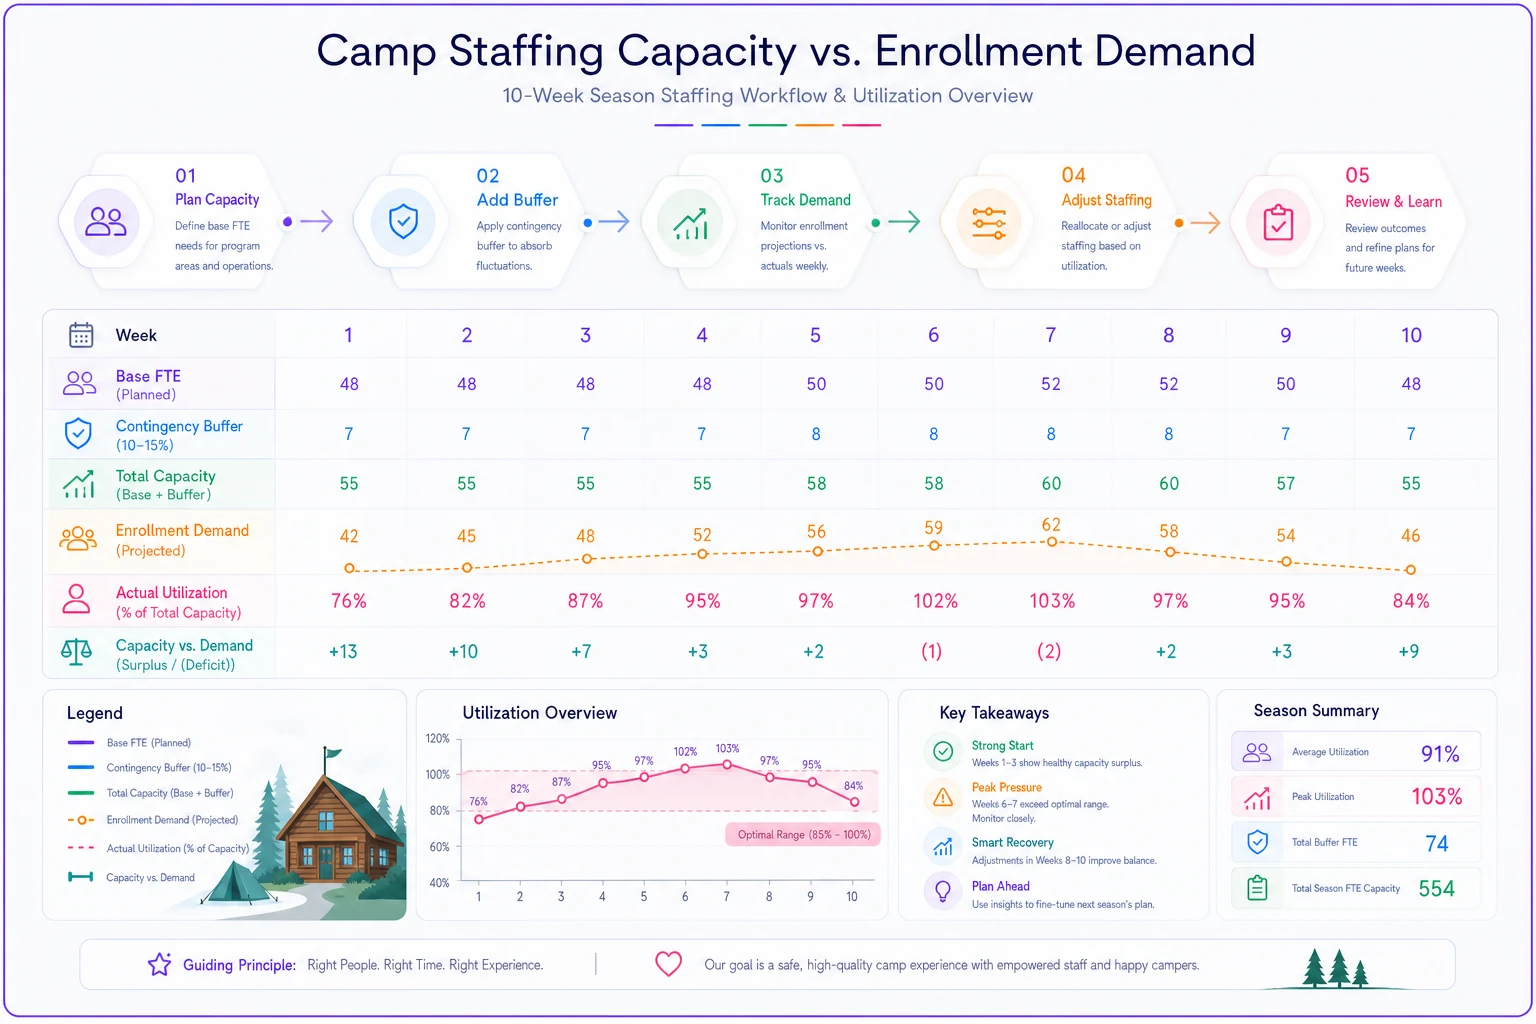
The visualization maps base FTE, contingency buffer, and actual utilization week by week to highlight where coverage gaps are likely to occur.
Technology Integration for Real-Time Capacity Tracking
Manual staffing spreadsheets work until someone calls in sick at 6am and you're scrambling to figure out who can cover morning swim lessons while also maintaining ratios at archery. More camps are moving toward operational platforms that automatically track capacity and flag coverage gaps before they become a problem.
The real advantage of AI-powered scheduling isn't just speed—it's visibility. When three counselors request the same day off, the system immediately calculates whether you'll drop below minimum ratios for any activity and surfaces coverage options based on certifications and availability. That kind of automatic cross-referencing would take a director 20–30 minutes to work through manually, every single time.
Real-time capacity tracking also surfaces patterns humans tend to miss. Maybe Tuesday afternoons consistently run thin because most part-time staff have other commitments that day. Or your waterfront is overstaffed on Thursdays when fewer campers choose swimming. These are the kinds of patterns that let you optimize schedules proactively rather than reacting to problems mid-week.
Connecting staffing to your broader operational framework also reveals useful correlations. Higher counselor-to-camper ratios might track with fewer behavioral incidents. Better activity coverage could tie to parent satisfaction scores. Without connected systems, those relationships stay invisible and you keep making the same guesses every year.
The investment usually pays off. If better capacity management prevents just two mid-season emergency hires—with their associated recruitment, training, and housing costs—most platforms cover themselves in the first season.
Common Pitfalls in Camp Staffing Models
Even with solid formulas and contingency planning, certain mistakes consistently derail camp staffing models.
The first is forgetting about non-program coverage needs. Camps calculate counselor ratios carefully but forget who supervises rest hour, overnight coverage for residential programs, meal supervision, and transitions between activities. These "invisible" hours can add 25–30% to your real staffing needs.
Another common mistake is treating all staff as interchangeable. Your spreadsheet might show adequate coverage, but if your three floaters all lack water certifications, they can't actually cover waterfront absences. Build your contingency pools with specific capability requirements, not just available headcount.
The "June optimism" problem hits most camps. Everything looks great during staff training when everyone's energized and committed. By July, reality sets in. Plan for some performance degradation after week 4—schedule lighter activity loads, build in more breaks, and have honest conversations about sustainable pacing before the season starts, not during it.
Camps also consistently underestimate documentation and administrative time. Every incident needs a report. Parent communications take longer than expected. Staff evaluations don't write themselves. Factor in 3–5 hours weekly per supervisor for administrative tasks, or watch program quality suffer as leaders are forced to choose between paperwork and actual camper supervision.
Building Your Implementation Timeline
Converting from ad-hoc staffing to a reproducible model takes real planning. Here's a realistic timeline that most camps can follow:
-
October–November (Post-Season) Analyze the previous summer's data. Where did you run short? Which calculations proved wrong? Build your base formulas using actual historical data, not theoretical ratios.
-
December–January Create your spreadsheet framework or evaluate operational platforms. Test formulas against different enrollment scenarios. Get buy-in from leadership on contingency funding before recruiting starts.
-
February–March Begin recruitment with clear targets based on your model. Don't just hire "counselors"—hire for specific capacity needs identified in your calculations.
-
April–May Refine projections based on actual enrollment. Adjust contingency pools based on real staff commitments. Run coverage scenarios to identify potential gaps before they arrive.
-
June (Pre-Season) Train staff on the coverage model so they understand how scheduling decisions get made. Set expectations around flexibility and cross-training requirements upfront.
-
During Season Track actual vs. projected metrics weekly. Document coverage gaps and solutions for next year's planning. Adjust in real-time but record why changes were needed.
-
Post-Season Compare your model's predictions to actual needs. Refine formulas based on real data. Document lessons learned before everyone disperses and institutional knowledge walks out the door.
Following a consistent cycle like this means you're building on real evidence each year rather than starting over from gut instinct every October.
Making the Model Sustainable
The best camp staffing model means nothing if it's too complex to maintain or lives entirely in one person's head. Sustainability has to be built in from the start.
Document every formula and the reasoning behind it. When you land on a 1.2 FTE multiplier for adventure activities, write down why. Include example calculations someone new can follow. Create a decision tree for common scenarios—what happens when enrollment jumps 20%? What if you can't find certified climbing instructors by June?
Train multiple people on the model. Your assistant director should understand the calculations as well as you do. Your waterfront director should know how their department's staffing connects to overall capacity. Shared ownership prevents knowledge loss and genuinely improves buy-in across the team.
Review and adjust annually, but resist the urge to rebuild from scratch every year. Small adjustments based on real data beat dramatic overhauls based on gut instinct. Track which elements of your model prove accurate and which consistently miss—maybe your contingency calculations hold up well but your activity duration estimates always run short.
And accept that no model perfectly predicts the chaos of running summer camp. Teenagers quit via text message. Counselors get homesick. That one amazing instructor covering three specialty areas gets offered a better job in mid-July. Your model's job isn't to prevent those situations—it's to help you respond systematically instead of panicking when they happen.
Building a reproducible camp staffing model turns one of the most stressful parts of camp operations into something actually manageable. The formulas, contingency buckets, and seasonal spreadsheets here aren't theoretical—they reflect real patterns from camps working through the same capacity challenges year after year.
Camps that thrive don't just count heads and hope for the best. They build frameworks that account for the reality of seasonal operations with young, temporary staff. They plan for problems before they arrive. They use tools—whether carefully built spreadsheets or AI-powered operational platforms—to track capacity in real-time rather than discovering gaps during Monday morning activity blocks. Your staffing model becomes the foundation everything else runs on. Get it right, and programs run smoothly, counselors avoid burnout, and directors actually sleep in July. Get it wrong, and you're pulling kitchen staff to supervise swimming while parents wonder why their kid's favorite activity got cancelled. Start with the basics: calculate true FTE needs by activity, build realistic contingency pools, and create tracking systems that surface problems before they become emergencies. Scale the complexity as your camp grows, but hold onto the core principle—staffing is a system to be optimized, not a problem to survive each summer.
Ready to elevate your camp management?
Join 500+ camps using Campyly to save administrative time, enhance camper experiences, and streamline daily operations.